Gaussian

Gaussian for Computational Chemistry.

For nearly 40 years, the Gaussian series has been a leader in electronic structure programs. The latest version, Gaussian 16, offers cutting-edge methods and capabilities that allow researchers to tackle increasingly complex molecular systems across diverse areas of chemistry. When combined with GaussView 6, which provides a comprehensive suite of building and visualization tools, the Gaussian environment sets the standard for computational chemistry. This suite empowers researchers with powerful features and innovations, solidifying Gaussian’s position as the premier choice for scientists worldwide.

  • Cutting-edge electronic structure methods: Gaussian 16 offers state-of-the-art capabilities for studying complex molecules.
  • Broad applicability: The program can be applied to diverse areas of chemistry.
  • Scalability: Gaussian 16 allows researchers to tackle increasingly larger molecular systems.
  • Integrated visualization: Combined with GaussView 6, Gaussian provides a seamless workflow from building molecules to visualizing results.
  • Established leader: With a 40-year legacy, Gaussian is the trusted choice for computational chemists around the world.

An Introduction to Gaussian and GaussView


Continuing the nearly 40-year tradition of the Gaussian series of electronic structure programs, Gaussian 16 offers new methods and capabilities which allow you to study ever larger molecular systems and additional areas of chemistry. GaussView 6 offers a rich set of building and visualization capabilities. We highlight some of the most important features on this page.


Click To Read About Exploring New Substances and Environments: Green Fluorescent Protein.
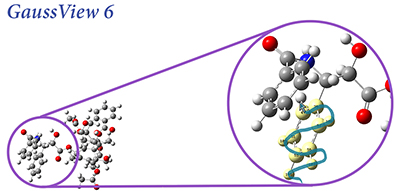
An example of a blue molecule with a close up internal view of the molecule.
Molecule Image used as an icon

About Gaussian

Capabilities of Gaussian

Gaussian 16 is the latest version of the Gaussian series of electronic structure programs, used by chemists, chemical engineers, biochemists, physicists and other scientists worldwide. Gaussian 16 provides a wide-ranging suite of the most advanced modeling capabilities available. You can use it to investigate the real-world chemical problems that interest you, in all of their complexity, even on modest computer hardware.


Read More To Explore The Capabilities and What You Will Receive Within Your Gaussian Environment Here.


A Molecule representing how advanced Gaussian is.

GaussView 6

The most advanced and powerful graphical interface.

GaussView 6 is the latest iteration of a graphical interface used with Gaussian. It aids in the creation of Gaussian input files, enables the user to run Gaussian calculations from a graphical interface without the need for using a command line instruction, and helps in the interpretation of Gaussian output (e.g., you can use it to plot properties, animate vibrations, visualize computed spectra, etc.).

    Please Click Here And Learn More On The GaussView 6 GUI.

    molecule overview Icon

    Chemistry In Solution

    Chemistry in Solution

    A substantial part of interesting chemical processes occurs in solution. The presence of a solvent can change molecular structure, molecular properties, the relative energies of isomers, the relative abundances of conformations, and many other important factors. Chemistry can also change from one solvent to another.

    All available molecular properties can be predicted in solution. Solvation can be included in calculations on both ground state and excited state systems and in ONIOM models.


    Click To Read About Chemical Processes That Occur In Solution In Gaussian.

    image of a molecule icon

    Investigating Large Systems

    Investigating Large Systems with ONIOM

    The wide variety of theoretical methods and basis sets available in Gaussian include many that are highly accurate. Unfortunately, such model chemistries scale unfavorably with the size of the molecule, resulting in a practical limit on how large a system can be studied. Gaussian’s ONIOM facility provides a means for overcoming these limitations, allowing you to study large systems that would otherwise be out of reach to all but the cheapest methods.

    Read More Here On Large Systems With Gaussian and ONIOM.

    A Light blue and darker blue image of molecules used for an icon.

    Modeling Spectroscopy

    Modeling Spectroscopy

    Spectroscopy is a fundamental tool for investigating molecular structures and properties. However, observed spectra are often difficult to interpret. The results of electronic structure calculations can be vital to this process. For example, predicted spectra can be examined in order to determine peak assignments in observed spectra as well as to compare peak locations and intensities with experimental data. Gaussian 16 can also compute relevant spectroscopic constants and related molecular properties with excellent accuracy. This combination of experimental observation and theoretical computation can yield very accurate structural and spectral data for compounds of interest.

    Read More Here To Fully Explorer Spectroscopy.

    An image of a red molecule used as an icon.

    Excited States

    Studying Excited State Chemistry

    Excited states are relevant to the study of a wide variety of phenomenon, including photosynthesis, photodecomposition, photochemical generation of electricity, perception of light in animals, fluorescence, bioluminescence, and more. Gaussian can calculate UV-Visible spectra, model processes and reactions on excited state potential energy surfaces and predict vibronic absorption and emission spectra. Calculations can be performed in the gas phase and in solution.

    Read On To Learn how Gaussian Aides WIth The Excited State Here.

    powerful yet simple molecule.

    Powerful Capabilities, Yet Simple to Use

    Powerful Capabilities, Yet Simple to Use

    Gaussian 16 makes running even quite complex calculations very simple to set up and specify. We highlight some of the features which accomplish this goal in this section.


    Learn About All The Power And Capabilities Here.

    A Light blue and darker blue image of molecules used for an icon.

    Application Examples

    Application Example: ROA Spectrum of Aeroplysinin-1

    Aeroplysinin-1 is a brominated compound that is of interest as an antiangiogenic drug [NietoOrtega11]. Here we will briefly discuss how Gaussian and GaussView can be used to predict its ROA spectrum in order to determine the molecule’s absolute configuration.
     

    Click To See Different Examples.

    A Molecule icon in blue

    Ease of Use

    Ease of Use Features

    Discover the ease of use with Gaussian, where intuitive interfaces and streamlined workflows simplify complex computational tasks. Effortlessly build, visualize, and analyze molecular systems with user-friendly tools designed for both novice and experienced researchers.


    Read About The Ease Of Use Features Within Gaussian and GausView Here.

    Features At A Glance

    Working with Gaussian 16 Features at a Glance

    Experience the cutting-edge advancements in Gaussian, featuring enhanced algorithms for researching larger molecular systems and exploring new areas of drug development. The latest version offers powerful new methods and capabilities that push the boundaries of computational chemistry.


    View The Features At A Glance List: Click Here

    Unlock the future of scientific discovery by starting your own computational chemistry environment. With state-of-the-art tools like Gaussian, you can dive into advanced molecular research, optimize drug candidates, and explore new chemical compounds with unparalleled precision and efficiency. Embrace the power of high-performance computing to accelerate your research, reduce costs, and stay at the forefront of innovation. Start your journey today and transform the way you conduct chemical research. with your own computational chemistry software environment.

    Start Today
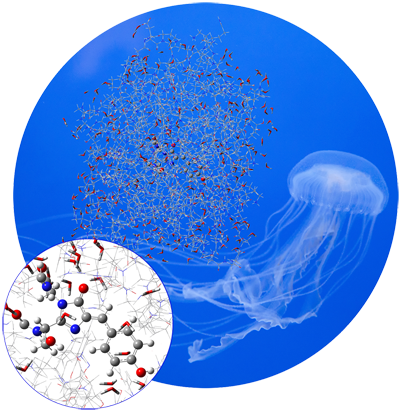
    Explore New Substances and Environments: Green Fluorescent Protein

    GFP is a protein that fluoresces bright green when exposed to light in the blue-to-ultraviolet range. The chromophore is shown in the inset below. The molecule was first isolated in the jellyfish species Aequorea victoria, which is native to the Pacific northwest coast of North America. Since then, it has been studied extensively, and variants of the molecule with enhanced fluorescence properties have been engineered.

    GFP consists of a chromophore within a protein chain composed of 238 amino acids. The isolated chromophore is not fluorescent, so modeling it in its protein environment is essential. GFP’s fluorescence cycle involves an initial excitation to its first excited state, a proton transfer reaction on the S1 potential energy surface, and finally a relaxation back to the ground state.

    The following features of Gaussian 16 and GaussView 6 are useful for modeling fluorescence in this compound:

    An example of a blue molecule with a close up internal view of the molecule.
    • GaussView can directly open files from the Protein Data Bank (PDB files). It can add hydrogens to the retrieved structure when imported or at a later time. You can also view, manipulate and modify the structure using the PDB chain, residue type and/or number, and other PDB substructure information present in the original file. Residue and other information can be retained throughout molecule editing and job execution.
    • The molecule can be modeled via MO:MM calculations using Gaussian’s ONIOM facility:
      • GaussView makes it easy to define ONIOM layers based on many different criteria. For this molecule, assigning atoms by PDB residue is often the most straightforward.
      • GaussView identifies molecular mechanics atoms types and partial charges automatically in most cases. It is also simple to locate atoms missing types and to specify/modify types and charges as desired. Gaussian incorporates standard MM parameters for Amber and other force fields and also allows you to define MM parameters as needed.
      • Gaussian’s ONIOM electronic embedding feature includes all of the effects of the protein environment without neglecting terms in the MM coupling with the chromophore QM treatment.
    • Explicit solvent molecules can be included in the calculation (e.g., water molecules above).
    • GaussView can directly open files from the Protein Data Bank (PDB files). It can add hydrogens to the retrieved structure when imported or at a later time. You can also view, manipulate and modify the structure using the PDB chain, residue type and/or number, and other PDB substructure information present in the original file. Residue and other information can be retained throughout molecule editing and job execution.
    • Gaussian can optimize the geometries of the minima and transition structures on the excited state PES with TD-DFT. GaussView includes features for setting up reliable QST2/QST3 transition structure optimizations with minimum effort.
    • An IRC calculation in Gaussian can follow the corresponding S1 PES reaction path, which can then be animated in GaussView.
    • Gaussian can perform vibrational frequency analysis in order to predict the IR/Raman spectra and normal modes. A variety of other spectra are also available, including vibronic spectra. GaussView can display plots of the predicted spectra and animate the associated normal modes (as applicable).
    • GaussView makes it easy to examine the results of one calculation and then set up and initiate the next calculation in sequence via an intuitive interface to all major Gaussian 16 features.

    [Thompson14] and [Petrone16] are excellent studies of GFP using the previous version of Gaussian. See chapter 9 of [Foresman15] for a detailed tutorial about preparing PDB files for use with the ONIOM facility in Gaussian.

    About Gaussian

    Gaussian 16 is the latest version of the Gaussian series of electronic structure programs used by chemists, chemical engineers, biochemists, physicists, and other scientists worldwide. Gaussian 16 provides a wide-ranging suite of the most advanced modeling capabilities available. You can use it to investigate the real-world chemical problems that interest you, in all of their complexity, even on modest computer hardware.

    What Sets Gaussian 16 Apart from Other Software?
    • Gaussian 16 produces accurate, reliable and complete models without cutting corners.
    • A wide variety of methods makes Gaussian 16 applicable to a broad range of chemical conditions, problem sizes and compounds.
    • Gaussian 16 provides state-of-the-art performance in single CPU, multiprocessor and multicore, cluster/network and GPU computing environments.
    • Setting up calculations is simple and straightforward, and even complex techniques are fully automated. The flexible, easy-to-use options give you complete control over calculation details when needed.
    • Calculation results are presented in natural and intuitive graphical form by GaussView 6.

    Fundamental Capabilities

    Starting from the fundamental laws of quantum mechanics, Gaussian 16 predicts the energies, molecular structures, vibrational frequencies and molecular properties of compounds and reactions in a wide variety of chemical environments. Gaussian 16’s models can be applied to both stable species and compounds which are difficult or impossible to observe experimentally, whether due to their nature (e.g., toxicity, combustibility, radioactivity) or their inherent fleeting nature (e.g., short-lived intermediates and transition structures).

    With Gaussian 16, you can thoroughly investigate the chemical problems that interest you. For example, not only can you minimize molecular structures rapidly and reliably, you can also predict the structures of transition states, and verify that the predicted stationary points are in fact minima or transition structure (as appropriate). You can go on to compute the reaction path by following the intrinsic reaction coordinate (IRC) and determine which reactants and products are connected by a given transition structure. Once you have a complete picture of the potential energy surface, reaction energies and barriers can be accurately predicted. You can also predict a wide variety of chemical properties.

    Gaussian 16 offers a wide range of methods for modeling compounds and chemical processes, including:

    • Molecular mechanicsEGF: Amber, UFF, Dreiding
    • Semi-empirical methodsEGF†: AM1, PM6, PM7, DFTB, among others
    • Hartree-FockEGF
    • Density functional (DFT) methodsEGF, with support for a plethora of published functionals; long-range and empirical dispersion corrections are available where defined
    • Complete active space self-consistent field (CASSCF)EGF, including RAS support and conical intersection optimizations
    • Møller-Plesset perturbation theory: MP2EGF, MP3EG, MP4(SDQ)EG, MP4(SDTQ)E, MP5E
    • Coupled cluster: CCDEG, CCSDEG, CCSD(T)E
    • Brueckner doubles: BDEG, BD(T)E
    • Outer Valence Green’s Function (OVGF): ionization potentials and electron affinities
    • High accuracy energy models: G1-G4, CBS series and W1 series, all with variants
    • Excited state methods: TD-DFTEGF, EOM-CCSDEG and SAC-CIEG

    EEnergies; GAnalytic gradients; FAnalytic frequencies; F†Reimplemented with analytic frequencies.

    A wide range of Gaussian results can be examined with GaussView’s visualization capabilities:

    • Molecule annotations and/or property-specific coloring: e.g., atomic charges, bond orders, NMR chemical shifts
    • Plots, including NMR, vibrational and vibronic spectra
    • Surfaces or contours: e.g., molecular orbitals, electron density, spin density. Properties such as the electrostatic potential can be visualized as a colorized density surface.
    • Animations: e.g., normal modes, IRC paths, geometry optimizations

    Molecular Properties in Gaussian 16

    Antiferromagnetic coupling
    Atomic charges
    ΔG of solvation
    Dipole moment
    Electron affinities
    Electron density
    Electronic circular dichroism (ECD)
    Electrostatic potential
    Electrostatic potential-derived charges
    Electronic transition band shape
    High accuracy energies
    Hyperfine coupling constants (anisotropic)
    Hyperfine spectra tensors (including g tensors)
    Ionization potentials
    IR and Raman spectra*
    Pre-resonance Raman spectra*
    Resonance Raman spectra
    Molecular orbitals
    Multipole moments
    NMR shielding and chemical shifts
    NMR spin-spin coupling constants
    Optical rotations (ORD)
    Polarizabilities/hyperpolarizabilities
    Raman optical activity (ROA)*
    Thermochemical analysis
    UV/Visible spectra
    Vibration-rotation coupling
    Vibrational circular dichroism (VCD)*
    Vibronic (absorption and emission) spectra

    *Harmonic approx. and including anharmonic effects

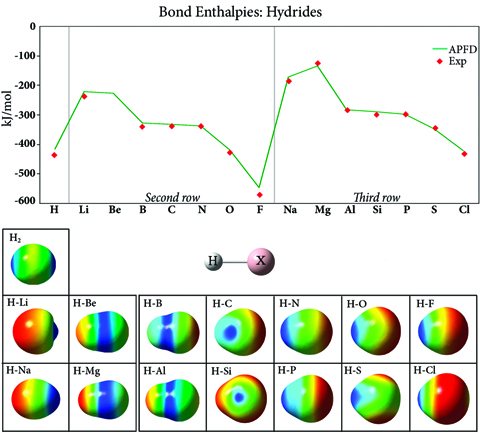
    A chart showing bond-enthalpies-hydrides and a graph chart.

    Bond Enthalpies and Electrostatic Potentials in Hydrides

    This graph plots the bond strength in second and third row hydride compounds (experiment: [CRC00]), which generally increases across the periodic table, with the strongest bond occurring in the element just before the noble gas. The plot has a similar overall shape for both rows, but the values for the third row are higher, due to the additional shielding from the nucleus by the filled second shell. The images show the electrostatic potential for each compound mapped onto an isodensity surface. The H2 surface illustrates the covalent nature of this bond; the bonds in the other hydride compounds are ionic. The negative electrostatic potential (red) is localized on the hydrogen atom at the beginning of each row, and it moves to the substituent as the atomic number increases within a row. Thus, hydride bond strengths increase across a period (row) and decrease as you go down a group (column), due to changes in electronegativity.

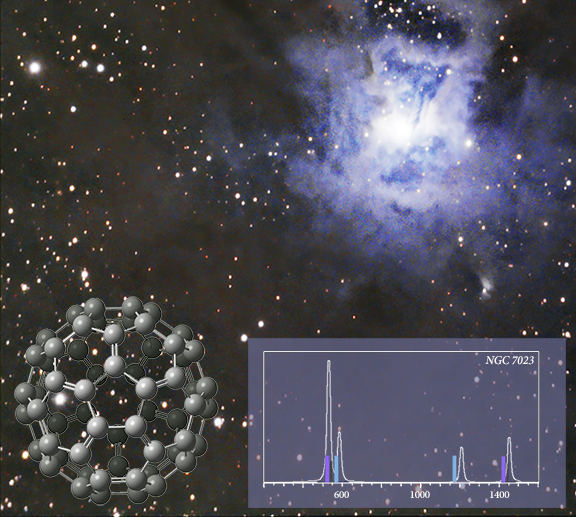
    C60-in-Interstellar-Space

    C60 in Interstellar Space

    C60 was detected in IR observations of the Iris nebula (NGC 7023) in 2004 [Werner04, Sellgren10]. The inset graph shows the peak locations identified from the data (solid bars) superimposed on the spectrum predicted by the APFD/6-311+G(2d,p) model chemistry. The strongest peaks (purple) differ from the laboratory IR spectrum by 0.03-0.06 μm.

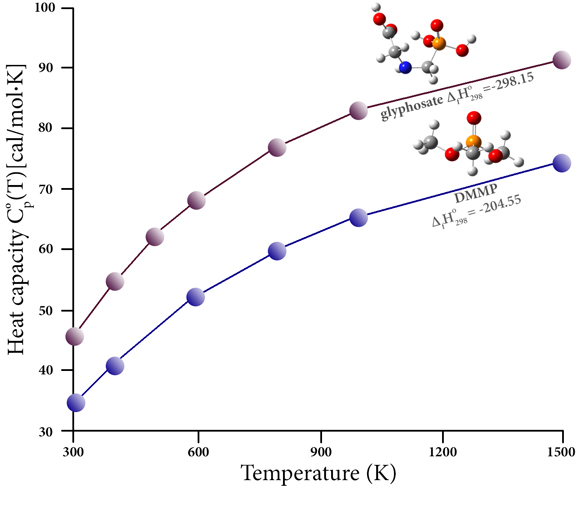
    Thermochemistry of Organophosphorous Pesticides showing heat capacity

    Thermochemistry of Organophosphorous Pesticides

    Organophosphorous compounds are commonly used as pesticides (among many other applications). These compounds adversely affect human health, due to both their inherent toxicity and from the harmful products created during combustion (e.g., as a result of burning previously-treated plant material). The decomposition of these compounds is difficult to study experimentally; thermochemical data for them is scarce. However, high accuracy thermochemistry predictions can bridge this gap and allow the thermal stability of the relevant compounds and combustion products to be studied. For example, this graph plots the heat capacity as a function of temperature for two such compounds: the pesticide glyphosate and the more benign flame retardant compound dimethyl methylphosphonate (DMMP). It also reports their heats of formation (kcal/mol), as predicted by the CBS-QB3 calculations of Khalfa and coworkers [Khalfa15]. Their paper presents computed results for a large number of trivalent and pentavalent phosphorus compounds, data which enables them to propose 83 original groups for use in the semi-empirical group contribution method of Benson, and thereby allows them to evaluate the thermochemical properties of some common pesticides, herbicides and related compounds.

    Explore Exotic Parts of the Periodic Table

    Gaussian provides features for modeling heavy elements for which relativistic effects are significant. The Stuttgart-Dresden and Ahlrichs group basis sets+ECPs are built-in, and their treatments of specific elements can be merged with other standard basis sets via very simple input specifications.

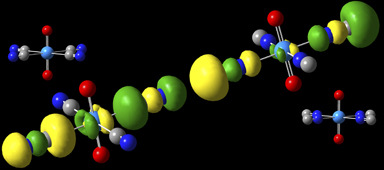
    An image of compounds that were modeled with the B3LYP/aug-cc-pVDZ model chemistry.

    Highest occupied MOs for [UO2(NC)4]2– and [UO2(CN)4]2-

    These compounds were modeled with the B3LYP/aug-cc-pVDZ model chemistry, using the Stuttgart/Dresden ECP and [7s 6p 5d 3f] basis set on uranium [Sonnenberg05]. In general, the MOs are more stabilized in the CN complex (left) compared to the NC complex (right). For example, in the HOMOs, the 5σ orbitals localized on the carbon atoms are pointing toward the uranium atom in the former while they are pointing away from it in the latter, and the group’s bond length to the U is 0.13Å longer in CN complex.

    A graph showing Chemical Shifts in Transition Metal Complexes.

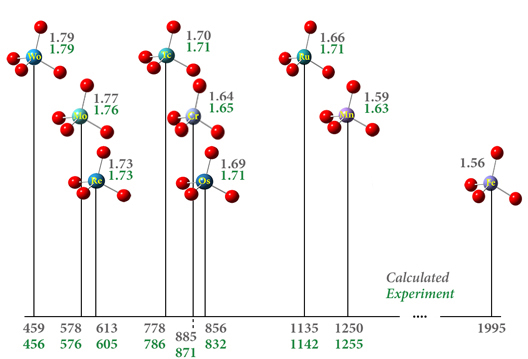
    17O Chemical Shifts in Transition Metal Complexes

    This figure reports the predicted chemical shift with respect to water vapor (ppm) and the oxygen-substituent bond length (Å) for a series of transition metal complexes (values in grey). These compounds are modeled using the APFD functional with the def2-TZVPP basis set and ECPs on the metal atoms. The results are in excellent agreement with experiment (values in green: [Kaupp95, Kaupp95a]).

    GaussView 6 Graphical User Interface For Use With Gaussian

    GaussView 6 is the most advanced and powerful graphical interface available for Gaussian 16. With GaussView, you can build or import the molecular structures that interest you, set up, launch, monitor and control Gaussian calculations, and view the predicted results graphically, all without ever leaving the application. GaussView 6 includes many new features designed to make working with large systems of chemical interest convenient and straightforward. It also provides full support for all of the new modeling methods and capabilities available in Gaussian 16.

    This brief introduction is a Quick Start to using GaussView 6 to investigate molecules and reactions with Gaussian 16. We invite you to try the techniques described here with your own molecules.

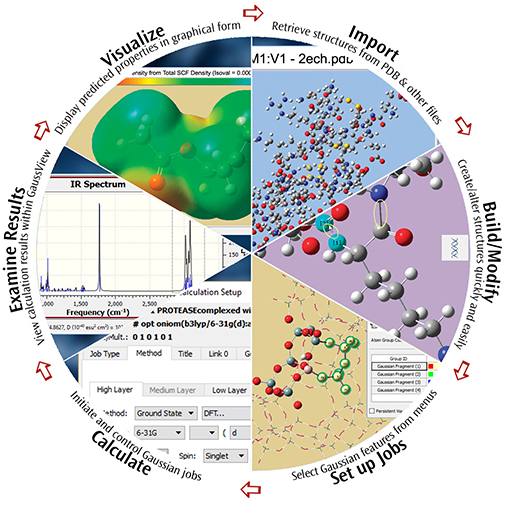
    Visualizing Molecules & Reactions wheel chart.

    Examples: Visualizing Molecules & Reactions with GaussView 6

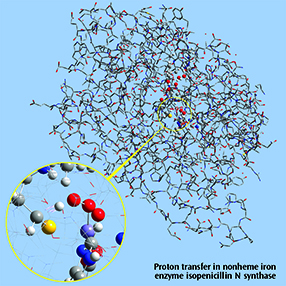
    Close up image of Proton transfer IRC, nonheme iron enzyme isopenicillin N synthase.

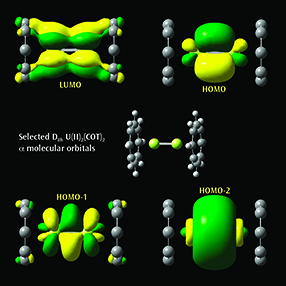
    Selected α molecular orbitals for U(II)2(COT)2

    Each monomer has 4 U valence electrons available for metal-metal bonding: 2 electrons in f σ-type MOs and 2 unpaired electrons in f δ-type MOs. Beginning at the upper left and moving clockwise, the MOs visualized in GaussView 6 are the LUMO, HOMO, and the second-lowest and next-lowest energy MOs below the HOMO; all have D8h symmetry [Zhou10].

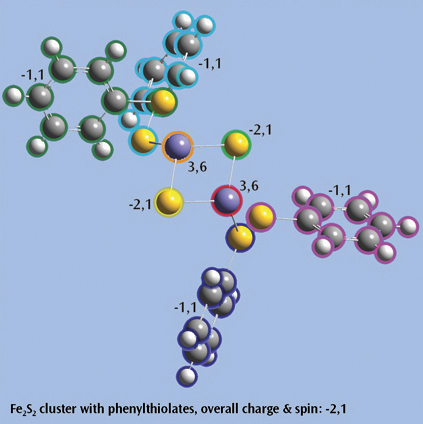
    Image of Fe2S2 cluster with phenylthiolates.

    Close up: Proton transfer IRC, nonheme iron enzyme isopenicillin N synthase (IPNS)

    This 5368-atom system was studied with the ONIOM method in Gaussian, and the results were visualized in GaussView 6. For illustration clarity, hydrogen atoms in the low layer are omitted from display in both the close up and full molecule views.

    The ONIOM high accuracy layer is visualized in ball-and-stick format; the low accuracy layer is visualized in wire frame format in the close up view and in tube format in the whole molecule view [Lundberg09].

    Image of selected molecular orbitals.

    Fe2S2 cluster with phenylthiolates

    This is an open shell singlet system with charge -2. It has been set up for a Gaussian fragment guess calculation to model antiferromagnetic coupling. Each iron atom and bridging sulfur atom is placed in its own fragment, and each phenylthiolate group similarly defines a fragment, resulting in a total of eight fragments.

    GaussView 6 will automatically place the individual charge and spin multiplicity values for the eight fragments (labeled in the illustration) into the route section of the Gaussian job. The resulting wavefunction is stable and optimizes to a proper minimum.

    Chemistry in Solution

    A substantial part of interesting chemical processes occurs in solution. The presence of a solvent can change molecular structure, molecular properties, the relative energies of isomers, the relative abundances of conformations, and many other important factors. Chemistry can also change from one solvent to another.

    All available molecular properties can be predicted in solution. Solvation can be included in calculations on both ground state and excited state systems and in ONIOM models.

    SCRF in Gaussian 16

    Compounds in solution are modeled with the self-consistent reaction field (SCRF) facility in Gaussian 16, the most advanced implementation available for this technique for handling solvation. Some of its major distinguishing feautures include:

    • Correct solvent response within the cavity by accounting for the so-called escaped charge density outside the cavity.
    • A continuous surface charge formalism that ensures continuity, smoothness and robustness of the reaction field, and which also has continuous derivatives with respect to atomic positions and external perturbing fields.
    • Integrated with excited state features:
      • Equilibrium and non-equilibrium solvation for excited state calculations to treat the two different ways in which the solvent can respond to changes in the state of the solute: by polarizing its electron distribution (a very rapid process), and by the solvent molecules reorienting themselves (a much slower process). An equilibrium calculation describes a situation where the solvent had time to fully respond to the solute (in both ways), e.g., a geometry optimization (a process that takes place on the same time scale as molecular motion in the solvent). A non-equilibrium calculation is appropriate for processes which are too rapid for the solvent to have time to fully respond, e.g. a vertical electronic excitation.
      • An external iteration procedure which allows partial relaxation of the excited state reaction field, as is appropriate for fluorescence and phosphorescence.
    Two Beakers with molecules in different colored sunstance.

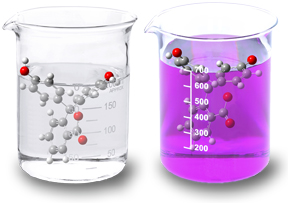
    Structure and Property Changes in Solution

    Phenolphthaline is the best known example of a change in molecular structure in solution. Its characteristic color change from clear in acidic solutions to pink in basic solutions results from a shift from a neutral lactone form to a phenolate (anion) form. In fact, the compound takes on two additional forms: in very strong acidic and in basic environments.

    Solvatochromism chart showing  its ability of the solvent environment to alter the relative energies of ground and excited electronic states.

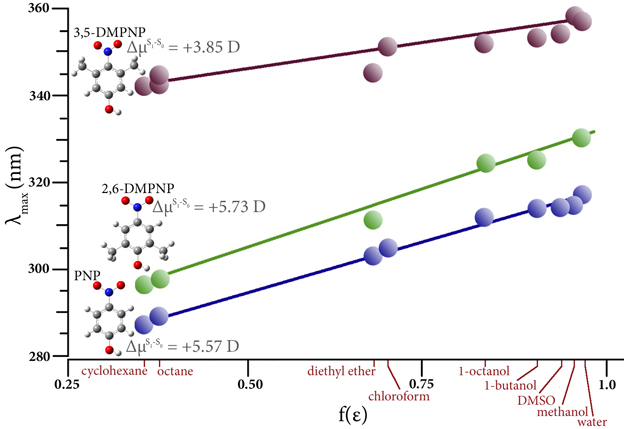
    Solvatochromism

    Solvatochromism is the ability of the solvent environment to alter the relative energies of ground and excited electronic states. This effect is typically seen in the absorbance spectrum of solutes whose excited states involve movement of electrons across the molecule. The figure plots the observed maximum absorption vs. the Onsager function of the solvent dielectric constant for three compounds in a range of solvents [Steel09]. There are two different solvatochromic behaviors. The electronic transitions in PNP and 2,6-DMPNO strongly depend on solvent polarity, while in 3,5-DMPNP λmax is shifted much less significantly. An electronic shift to longer wavelength means that the solute’s dipole is larger in the excited state relative to the gound state, and the differences in μ predicted by TD-DFT support the observed data.

    Accurate Free Energies of Solvation

    The energy change going from the gas phase to solution is known as the solvation energy of a molecule. It can be computed for the same compound with several solvents in order to understand its relative solubility in different environments. The predicted free energy can also be used to predict reaction energies in solution. The SMD method is an SCRF-based solvation model from Truhlar and coworkers [Marenich09]. It was parametrized specifically to predict free energies of solvation, and includes different values for the non-electrostatic terms.

    Investigating Large Systems with ONIOM

    The wide variety of theoretical methods and basis sets available in Gaussian include many that are highly accurate. Unfortunately, such model chemistries scale unfavorably with the size of the molecule, resulting in a practical limit on how large a system can be studied. Gaussian’s ONIOM facility provides a means for overcoming these limitations, allowing you to study large systems that would otherwise be out of reach to all but the cheapest methods. Originally developed by Morokuma and coworkers [Dapprich99], this computational technique models large molecules by defining two or three layers within the structure that are treated at different levels of accuracy. Calibration studies [Dapprich99, Vreven06a] demonstrated that the resulting predictions are essentially equivalent to those that would be produced by the high accuracy method alone on the entire molecule.

    ONIOM first appeared in Gaussian 98, and significant innovations over the years make it applicable to much larger molecules. Today, the ONIOM method is applicable to large molecules in many other areas, including enzyme reactions, reaction mechanisms for organic systems, cluster models of surfaces and surface reactions, photochemical processes of organic species, substituent effects and reactivity of organic and organometallic compounds, and homogeneous catalysis. For a recent review of the ONIOM method and many exemplary applications, see [Chung15] by Chung, Morokuma and coworkers.

    In addition to modeling systems which are too large to address as a whole by a method with the desired accuracy, ONIOM calculations are also useful for other chemical situations:

    • Compounds whose chemistry occurs within a protein environment. In such cases, ONIOM is needed both because of the sheer size of the molecule and because modeling, e.g., a chromophore in isolation is a poor model for its actual emission reaction.
    • Steric effects arising from ligands are another example where ONIOM aids in accurately modeling the fundamental chemistry. Ligands can be bulky and flexible, and compounds containing them can be too large to optimize with a desired method. However, merely truncating the ligands can lead to poor agreement with observations since they significantly influence molecular structure and reactivity. Modeling such systems with ONIOM, using either QM:QM or QM:MM methods, is both feasible and successful.
    • ONIOM may be useful for molecules whose size does not make them prohibitively expensive to model in a single form but for which there are a large number of conformations. ONIOM can aid in the conformation search process by significantly reducing the time required for each individual optimization.

    What is Unique About ONIOM in Gaussian 16?

    Many programs now include some version of QM:MM models (also known as MO:MM). However, Gaussian 16’s ONIOM facility is far more advanced and robust for several reasons:

    • It is a general facility allowing you to use any method for any layer, supporting both QM:MM and QM:QM models, with two or three layers.
    • Efficient and reliable energies, optimizations and frequencies are provided. Vibrational frequencies of the entire system can be efficiently computed without neglecting any MM coupling terms.
    • True IRC calculations can be performed (rather than mere “coordinate driving”).
    • Wavefunction stability testing and optimization are also supported.
    • All molecular properties are supported for ONIOM calculations.
    • ONIOM models can treat excited states.
    • Different initial guesses can be specified for each ONIOM layer, including retrieving results from previous jobs.
    An Image showing ONIOM Layers for Modeling GFP.

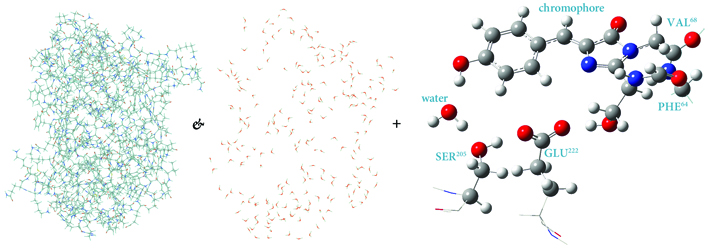
    ONIOM Layers for Modeling GFP

    Green fluorescent protein (GFP) is the molecule responsible for fluoresence in jellyfish. When exposed to light in the proper frequency range, it emits bright green light. It is a molecule that is ideal for modeling with ONIOM. The figure illustrates one possible partitioning for an ONIOM model. The majority of the protein and the crystallographic waters are placed in the ONIOM MM region (low layer) while the chromophore and important atoms on nearby residues comprise the QM region (high layer). Including the protein environment within the calculation is essential to determining the structure of the chromophore.

    An Image of Novel Yttrium-Phosphinidene Complex Molecules.

    A Novel Yttrium-Phosphinidene Complex

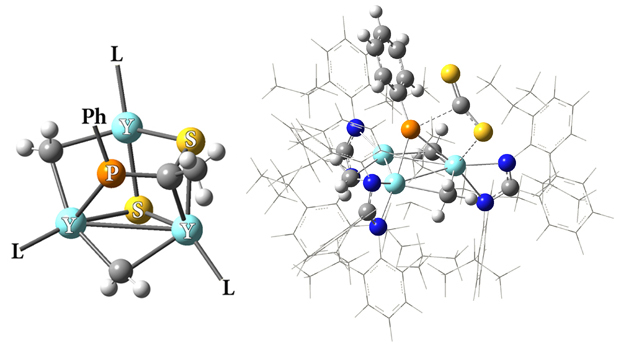
    Zhang and coworkers recently synthesized two novel trinuclear rare-earth metal phosphinidene complexes [Wang15]. The illustration focuses on the compound containing yttrium (the other complex contains lutetium). The central part of the newly-synthesized compound appears on the left, with the phenol group and the ligands truncated for clarity. The molecule on the right shows the partitioning used for their related ONIOM calculations; it depicts the first step of their proposed pathway, the reaction of the phosphinidene complex {[PhC(NC6H4iPr2-2,6)2](Y)(μ2-Me)}33-Me)(μ3-PPh) with CS2 in toluene. The high accuracy region contains the Y and P atoms and the most important groups bonded to them, the CS2 molecule weakly bound to the cluster, as well as the N-C-N group from each ligand. ONIOM (QM:QM) calculations allowed this very large molecule to be studied with accurate methods; the high layer used a DFT model, while Hartree-Fock was used for the bulk of the ligands. On the basis of their calculations, these researchers identified a potential pathway for the complete synthesis.

    Modeling Spectroscopy

    Spectroscopy is a fundamental tool for investigating molecular structures and properties. However, observed spectra are often difficult to interpret. The results of electronic structure calculations can be vital to this process. For example, predicted spectra can be examined in order to determine peak assignments in observed spectra as well as to compare peak locations and intensities with experimental data. Gaussian 16 can also compute relevant spectroscopic constants and related molecular properties with excellent accuracy. This combination of experimental observation and theoretical computation can yield very accurate structural and spectral data for compounds of interest.

    Gaussian 16 can predict a variety of spectra, in both the gas phase and in solution, including:

    • IR and Raman
    • NMR spectra and spin-spin coupling constants
    • Vibrational circular dichroism (VCD)
    • Raman optical activity (ROA)
    • Resonance Raman
    • UV/Visible
    • Vibronic absorption and emission spectra for excited states, via Franck-Condon and/or Herzberg-Teller analysis
    • Electronic circular dichroism (ECD) and circularly polarized luminescence (CPL)
    • Optical rotatory dispersion (ORD)
    • Hyperfine (microwave spectroscopy)
    • Anharmonic analysis is available for IR, Raman, VCD and ROA spectra.
    Harmonic vs. Anharmonic IR Spectrum of Naphthalene Chart.

    Harmonic vs. Anharmonic IR Spectrum of Naphthalene

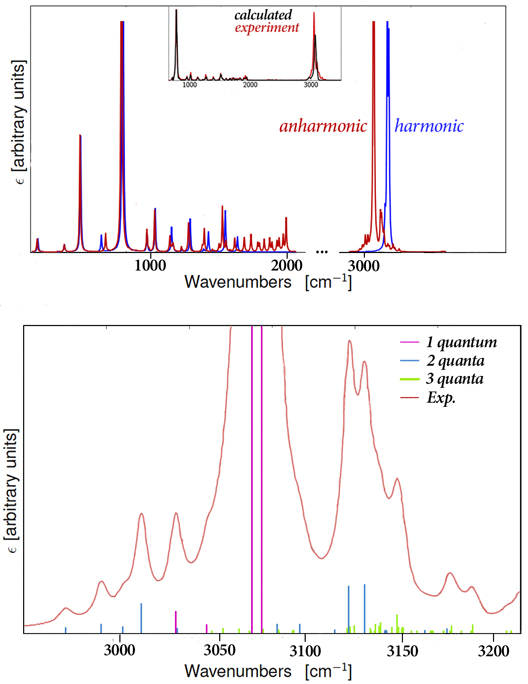
    Vibrational frequency analysis performed by default uses the harmonic approximation for performance reasons; it assumes that there are no interactions between vibrational modes. As a result, such analysis can only predict fundamental bands. However, observed spectra also often include overtone and combination bands. Anharmonic frequency analysis must be used to predict the latter band types and to achieve agreement with experiment in many cases. This figure illustrates the predicted IR spectrum for naphthalene. The harmonic (blue) and anharmonic (red) spectra are compared; in addition to shifting the location of several peaks, the anharmonic spectrum exhibits considerably more complexity (see, e.g., the 1600-2000 cm–1 range and the region above ~3000 cm–1). The anharmonic spectrum is plotted against experiment in the inset. The bottom plot focuses on the 2950-3250 cm–1 region and shows the contributions of fundamental, 2-quanta and 3-quanta modes to the overall spectrum.

    Modeling NMR Spin-Spin Coupling Constants

    Spin-spin coupling constants are one of the most difficult spectral data to produce quantitatively. The accuracy of calculations is highly dependent on the basis set used. While the standard basis sets of quantum chemistry are well developed for valence electrons, a more sophisticated description of the electron density closer to the nuclei is needed for predicting the Fermi contact (FC) term (often the spin-spin coupling constants’ largest component). Researchers at Gaussian, Inc. have explored this problem in depth and have developed modified basis sets suitable for modeling these quantities within a DFT framework [Deng06]. Gaussian 16 can automatically perform a two-step calculation for NMR spin-spin coupling, using the standard basis set for the general calculation and the corresponding modified basis set for the FC term.

    New Basis Sets for Computing NMR Spin-Spin Coupling Constants
    Basis Set Derived from Accuracy Improvement
    uTZ-w aug-cc-pVTZ 650% (ΔAAE=-20 Hz, AAE=3.6 Hz)
    uDZ-w aug-cc-pVDZ 590% (ΔAAE=-41 Hz, AAE=8.7 Hz)
    uG-w 6-311+G(d,p) 415% (ΔAAE=-33 Hz, AAE=10.3 Hz)

    Larger improvement percentages are better (AAE: average absolute error with respect to the basis set limit). Recommended basis sets are arranged from largest (top) to smallest.

    Studying Chirality

    Chiral molecules are of great importance in many research contexts. Gaussian 16 can study chirality with several techniques including two spectroscopic classes: VCD and ROA. Both types of spectra can be predicted including anharmonic vibrational analysis.

    Four Charts showing distinguishing Chiral Products with VCD.

    Distinguishing Chiral Products with VCD

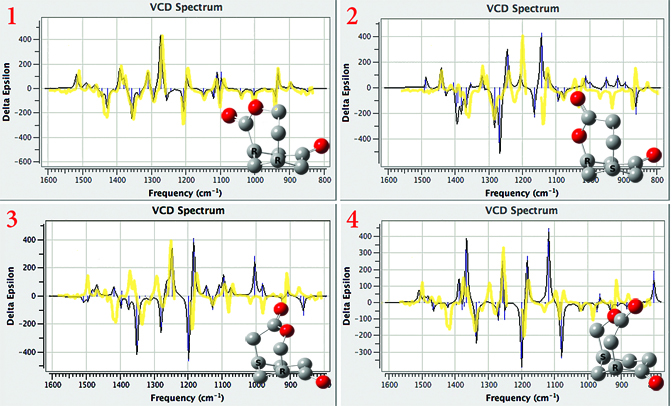
    The Baeyer-Villiger oxidation of (+)-(1R,5S)-bicyclo[3.3.1]nonane-2,7-dione has four possible keto-lactone products. VCD calculations can determine which one is the actual product by comparing their predicted spectra to the observed one. We’ve overlaid the observed spectrum (yellow, from [Stephens05a]) on each of the plots. Isomer 1 can be identified as the product structure, and there is excellent agreement between theory and experiment.

    ORD Spectra of Substituted Oxiranes chart.

    ORD Spectra of Substituted Oxiranes

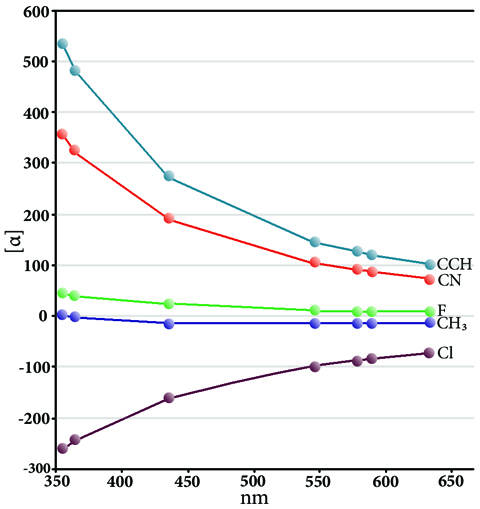
    When polarized light travels through some materials, it is rotated with respect to the direction of motion. Such materials include crystals, spin-polarized molecules in the gas phase and chiral molecules. As with other observed effects of chirality, optical rotation differs for left and right circularly polarized light, and it can give important information about molecular structure for chiral molecules. Observed optical rotations vary for the same substance according to the wavelength of the incident light. This variation is known as optical rotatory dispersion (ORD). ORD results plot the observed rotation for various incident light wavelengths. This plot shows the predicted optical rotations for a series of substituted oxirane compounds for a series of incident light frequencies in the range 350-650 nm [Wilson05, Wiberg07]. In general, the curves exhibit increased specific rotations with decreasing incident light frequency. The chlorine compound is an exception, and it exhibits an opposite change, an example of the anomeric effect; here, electron density moves from the lone pair to the σ* orbital of the C–Cl bond, resulting in a longer bond length and energetic stabilization [Wiberg07].

    Modeling Microwave Spectroscopy

    Molecular rotational transitions are split by a variety of interactions between the overall rotational motion of the molecule and both the electron distribution and spins of the nuclei, yielding the so-called fine structure, which can be measured with very great accuracy. For molecules with unpaired electrons, the fine structure itself can be further split as a result of additional factors including the magnetic interactions between the magnetic moment and induced fields of the electron with those of the nucleus. The effect is known as hyperfine coupling, and it is studied experimentally with microwave spectroscopy. It can also be modeled by Gaussian.

    Calculations can also aid in interpreting experimental data. They suggest regions in which to look for transitions, which can make experiments more efficient. Theoretical results are also useful for making spectral assignments for observed peaks, which can be difficult or impossible to determine solely from the raw experimental data. Computed tensors can also be combined with observations in fitting operations. Using computations to aid in interpreting and fitting observed results should make non-linear molecules as amenable to study as linear ones.

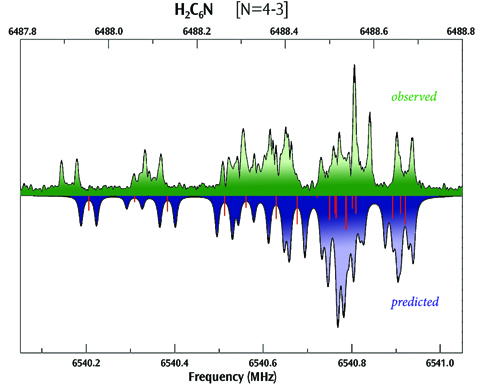
    This plot compares the observed (top) and computed (bottom) hyperfine spectra.

    Hyperfine Spectrum for H2C6N

    This plot compares the observed (top) and computed (bottom) hyperfine spectra for H2C6N, showing very good agreement between the two (experimental data provided by S. E. Novick, W. Chen, M. C. McCarthy and P. Thaddeus).

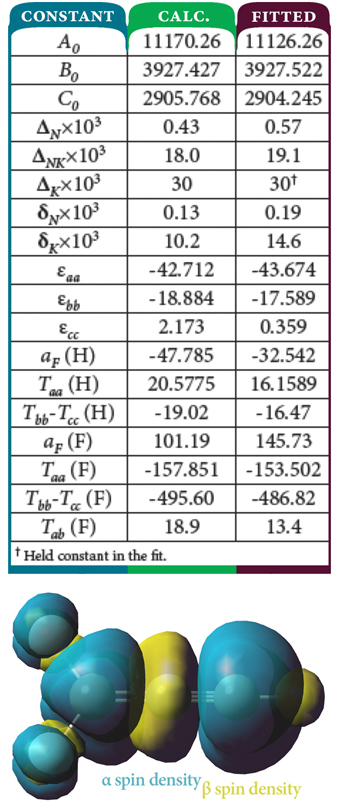
    F2CC≡CH Hyperfine Coupling Constants and Spin Density Chart and image.

    F2CC≡CH Hyperfine Coupling Constants and Spin Density

    Researchers have also studied the 1,1-difluoroprop-2-ynyl radical, F2CC≡CH, a partially fluorinated variant of the propargyl radical. The combination of the observed microwave spectral data and calculation of various hyperfine tensors determined that the compound has a planar structure, a somewhat unexpected result. The table at the top compares the predicted values of many constants for this compound with those fitted from experimental data [Kang06], showing excellent agreement between them. The figure below the table shows the spin density for the molecule, with the α spin density in teal and the β spin density in yellow, situated perpendicular (top) and parallel to the plane of the molecule. Note the abundance of α spin density in both potential locations for the unpaired electron—the two end carbon atoms—as well as the small amount of β spin density on the H atom.

    Studying Excited State Chemistry

    Excited states are relevant to the study of a wide variety of phenomenon, including photosynthesis, photodecomposition, photochemical generation of electricity, perception of light in animals, fluorescence, bioluminescence, and more. Gaussian can calculate UV-Visible spectra, model processes and reactions on excited state potential energy surfaces and predict vibronic absorption and emission spectra. Calculations can be performed in the gas phase and in solution.

    Excited state methods and properties received a lot of attention as we developed Gaussian 16. With its analytic TD-DFT frequencies, you can efficiently optimize excited state transition structures, perform IRC calculations and predict vibronic spectra. Analytic EOM-CCSD gradients let you optimize the structures of molecules that require a high accuracy excited state treatment. CASSCF calculations can be performed to model structures for which multireference effects are vital; active spaces of up to 16 orbitals are supported.

    Image of a Firefly in Bioluminescence.

    Firefly Bioluminescence

    Bioluminescence is a fascinating phenomenon: light emission arising from chemical reactions within the bodies of animals (without photon absorption). In fireflies, the best known example of bioluminescence, the luciferin molecule undergoes a two-step enzyme-catalyzed reaction yielding oxyluciferin, a species formed in its excited state; oxyluciferin then decays to its ground state, emitting a yellow-green photon. In some circumstances, the emitted photon is shifted in color to red (the result of an acid environment for the reaction). Theoretical studies of firefly bioluminescence span almost 2 decades, and they use ever more accurate methods for studying it: semi-empirical methods, CI-Singles and, most recently, TD-DFT. Many important questions remain unresolved, though. For example, there are six forms of the bioluminophore oxyluciferin, and the question as to which is the light-emitting molecule is not completely resolved (see, e.g., [Cheng15, daSilva15]). Gaussian 16’s TD-DFT capabilites including analytic frequencies and ONIOM capabilities are ideal for the continued study of this phenomenon.

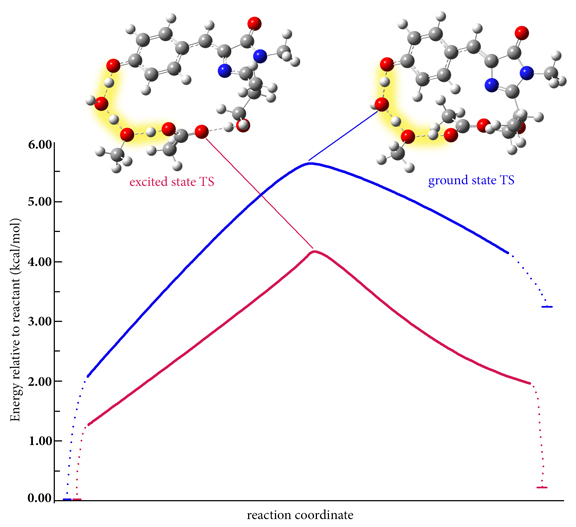
    A Chart of GFP Proton Shuttle Reaction IRC.

    GFP Proton Shuttle Reaction IRC

    These plots show idealized intrinsic reaction coordinate paths on the ground state and excited state PESs for the proton shuttle process in green fluorescent protein (GFP) studied by the Rega group (see [Petrone16] for the predicted paths). The S0 and S1 transition structures are illustrated, and the proton shuttling is highlighted. In both the ground state and the excited state, all three proton transfers are concerted and proceed via a single transition state. In the organism, the reaction occurs on the lower energy excited state PES (on average, ~2-3 kcal/mol below the ground state PES). The entire hydrogen bond network is more planar in the excited state, resulting in a tighter chromophore-water-residues packet. While the published results studied a model of the chromophore region, the TD-DFT analytic frequency feature in Gaussian 16 makes it possible to study the reaction in the protein environment with ONIOM.

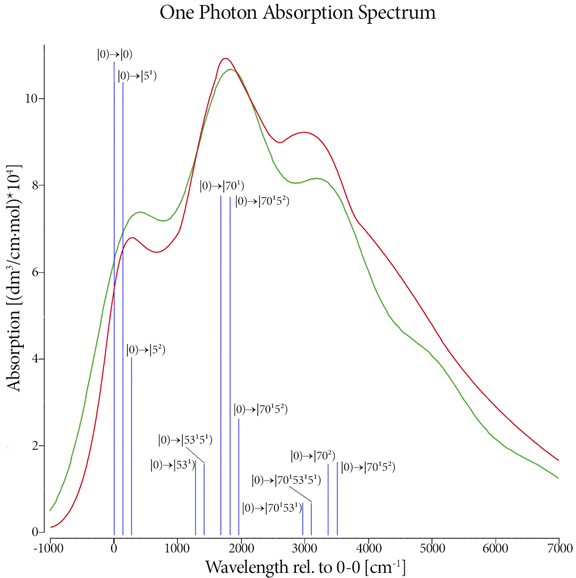
    One Photon Absorption Spectrum chart

    One Photon Absorption Spectrum

    This plot shows the predicted (red) and experimental (blue) one photon absorption spectrum for trans,trans-1,4-diphenyl-1,3-butadiene [Foresman15]. The transitions requested in the calculation are represented by the vertical green lines which we have labeled with their specific transition. There is excellent agreement between calculation and experiment.

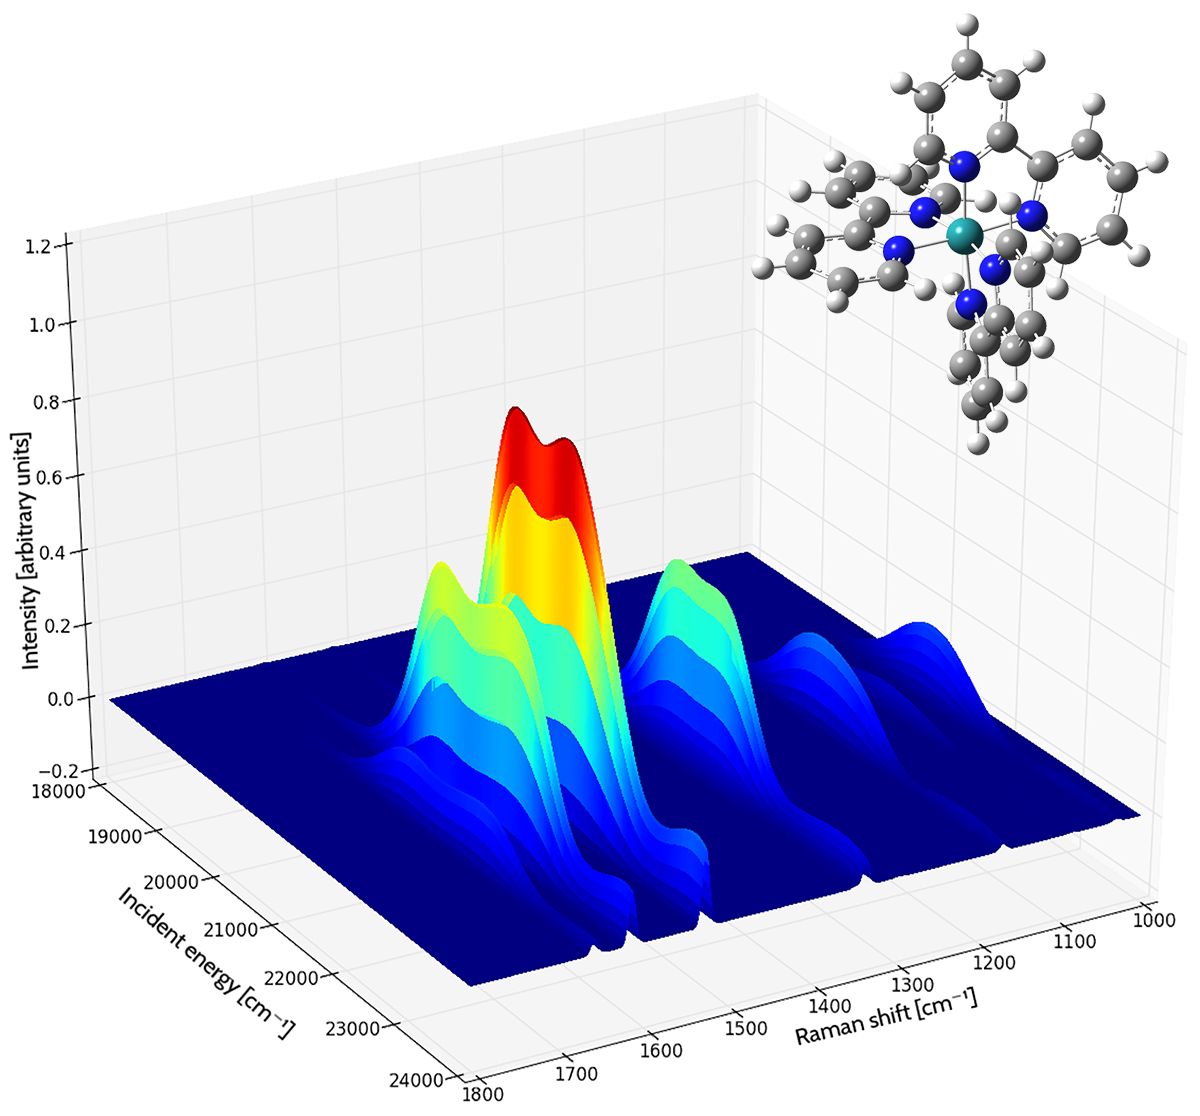
    Resonance Raman Spectrum of the tris(2,2’-bipyridyl)-ruthenium(II) Complex vibration chart.

    Resonance Raman Spectrum of the tris(2,2’-bipyridyl)-ruthenium(II) Complex

    Each curve shows the intensity of the Raman shift produced by various frequencies of incident light. The area under each curve is filled, colored by the magnitude of the intensity (blue to red as the intensity increases). The spectrum was computed in acetonitrile solution [Baiardi14].

    New Capabilities In Gaussian 16

    Sophisticated Modeling of Excited States

    Excited state methods and properties received a lot of attention as we developed Gaussian 16. With its analytic TD-DFT frequencies, you can optimize excited state transition structures and perform IRC calculations. Analytic EOM-CCSD gradients let you optimize the structures of molecules that require a high accuracy excited state treatment.

    Anharmonic Vibrational Analysis

    Standard vibrational frequency analysis employs the double harmonic approximation, the simplest description of the vibrations and the molecule’s interaction with the electromagnetic field of the incident photons. It treats nuclear vibrations as simple harmonic motion about the minimum energy structure and uses a correspondingly simplified model for the electromagnetic field interaction. For many systems, this is sufficient, but sometimes the approximation reduces the accuracy of the predicted spectra.

    Anharmonic frequency analysis relaxes both parts of the double harmonic approximation by introducing additional mathematical terms: higher derivatives of the energy, dipole moment, polarizability (as appropriate to the type of spectroscopy being modeled). Doing so results in changes in the locations of the fundamental frequencies and enables the prediction of overtone and combination bands. Later revisions of Gaussian 09 included anharmonic IR and Raman spectra, and Gaussian 16 adds anharmonic VCD and ROA spectra.

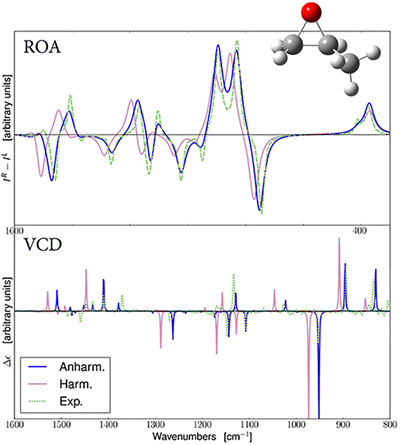
    methyloxrian vcd roa

    Predicted ROA and VCD Spectra for R-Methyloxirane

    The Spectra predicted with harmonic and anharmonic analyses are in pink and blue (respectively). The experimental spectra are in green [Merten13], and they have been added to the GaussView plot. For both ROA and VCD, the anharmonic results are in better agreement with the observed spectrum [Bloino15].

    Resonance Raman Spectroscopy

    Gaussian 16 can predict Resonance Raman (RR) spectra. RR spectroscopy is a type of Raman spectroscopy where the incident laser frequency is close in energy to an electronic transition of the compound being studied. This has the advantage of enhancing the intensity of the scattered light.

    These experiments typically scan over a range of frequencies for the incident light. The resulting data can be plotted as a three dimensional surface: the incident light frequencies and the corresponding observed peaks are plotted in the X-Y plane, with the intensity determining the height of the curve above the plane.

    res-raman-spectrum chart

    Resonance Raman Spectrum of the tris(2,2’-bipyridyl)-ruthenium(II) Complex

    Each curve shows the intensity of the Raman shift produced by various frequencies of incident light. The area under each curve is filled, colored by the magnitude of the intensity (blue to red as the intensity increases). The spectrum was computed in acetonitrile solution [Baiardi14].

    Franck-Condon/Herzberg-Teller Analysis and Vibronic Spectra

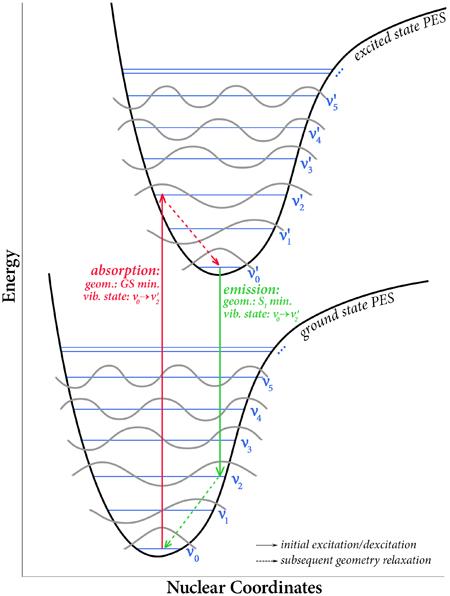
    Gaussian 16 can compute vibronically-resolved electronic spectroscopy for one photon absorption processes. In a vertical excitation resulting from the absorption of a photon, a molecule moves from its ground electronic state to an excited state. The geometry of the excited state immediately afterwards is not the equilibrium structure of the excited state, i.e., the minimum on the excited state potential energy surface. Rather, because the time scale in which electronic transitions occur is so small compared to nuclear motions, the nuclei are nearly unaffected, and the ground state equilibrium geometry is initially retained.

    Nuclear Coordinates in vibrational state

    A consequence of the geometry of the excited state being initially unchanged from the ground state is that the vibrational state taken on by the molecule in its excited state need not be the lowest one. Rather, when the molecule transitions to the excited state, it moves to a vibrational state that is instantaneously compatible with its current one.

    In reality, the actual energy transition observed in an experiment is a series of many energy transitions from the various vibrational levels of the ground state to the various vibrational levels of the excited state, with the strength of each individual transition depending on the population of that state and the overlap between the ground and excited vibrational wavefunctions for that transition.

    These effects are the basis of the Franck-Condon principle. Gaussian 09 introduced Franck-Condon and Herzberg-Teller analysis capabilities (as well as their combination), allowing these spectra to be predicted. Gaussian 16 significantly enhances these features, adding the ability to predict intensities, perform band assignment and providing other data about overlap between states.

    Below are examples of the results of Gaussian 16’s vibronic analysis capabilities as visualized in GaussView 6:
    The Duschinsky matrix image.

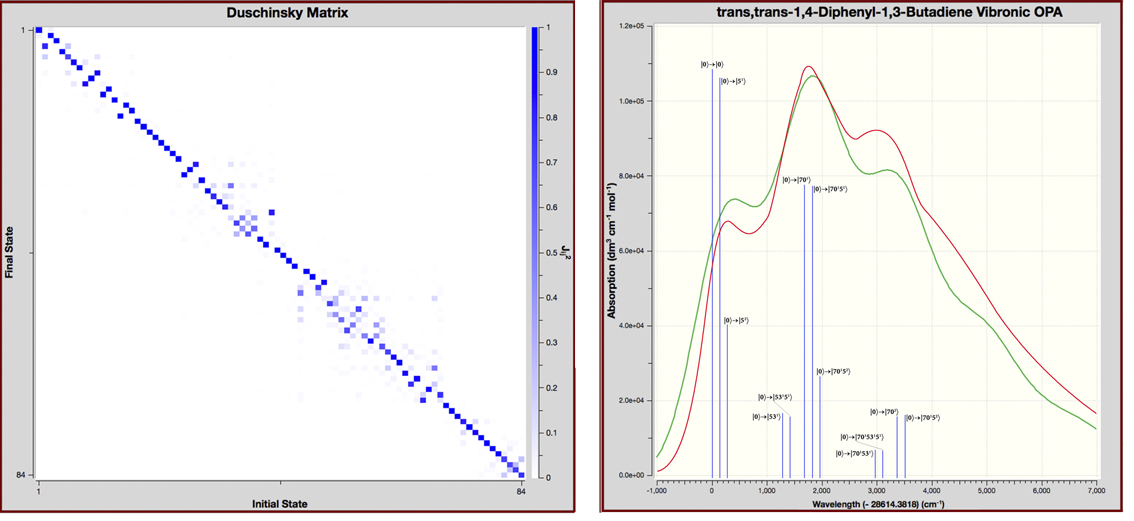
    Duschinsky Matrix and Vibronic One Photon Absorption Spectrum for trans,trans-1,4-Diphenyl-1,3-Butadiene

    The Duschinsky matrix (left) is a visual depiction of vibrational mode overlaps between the corresponding modes in the ground state and the excited state. It is a good approximation of this data so long as no large distortion occurs during the transition. In these plots, mode numbers for the ground state run along the X-axis, and those for the excited state run down the Y-axis. The intensities of the squares in the plot range from solid (100% state overlap) to about eight tone (~12% overlap). This example shows mostly strong overlap along the diagonal indicating that the Franck-Condon perturbation is a good approach to describing the vibronic coupling. Further, modes with significant differences can readily be identified.


    The plot on the right shows the predicted (red) and experimental (blue) vibronic spectrum for the same compound [Foresman15]. The transitions requested in the calculation are represented by the vertical green lines which we have labeled with their specific transition. We added the observed spectrum and transition labels to the GaussView display. Note that transitions can be computed for only a portion of the total spectrum if desired. The X-axis indicates the energy relative to the 0-0 transition (a GaussView plot option).

    Powerful Capabilities, Yet Simple to Use

    Gaussian 16 makes running even quite complex calculations very simple to set up and specify. We highlight some of the features which accomplish this goal in this section.

    Fragments

    Gaussian offers the ability to define regions within a molecule for modeling effects such as antiferromagnetic coupling and computing counterpoise corrections.

    Modeling Antiferromagnetic Coupling Chart.

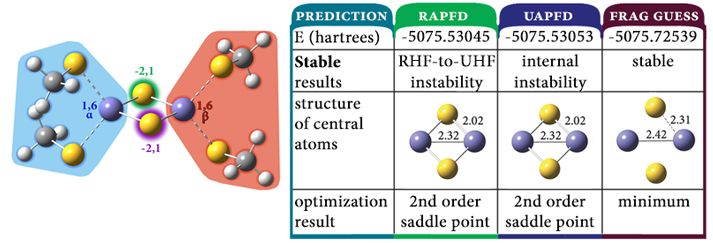
    Modeling Antiferromagnetic Coupling

    The dimer of FeS(SCH3)2 is a simple model for ferredoxins, a class of proteins that facilitate electron transfer reactions in organisms. Accurately modeling this system requires taking its complex electronic configuration into account: each of the Fe(III) atoms has five unpaired electrons: one iron atom has five α electrons, and the other iron atom has five β electrons. We need to provide these details to Gaussian so that the program can construct an appropriate wavefunction. This can be accomplished by defining regions—fragments—within the molecule for which these items can be specified individually. For this system, we define four fragments as indicated by the colored shading. The results of our complete study of this system indicate that the antiferromagnetic singlet is in fact the ground state wavefunction for this molecule, and the optimization using it successfully locates a minimum. In contrast, optimizations using the default wavefunction for both closed shell and open shell calculations result in second-order saddle points characterized by much shorter Fe-S and Fe-Fe bond lengths. This application is an example of antiferromagnetic coupling: the stabilization in substances in which equal numbers of unpaired electrons of each spin type arranged in a pattern with neighboring spins having opposite polarity.

    Wavefunction Stability Analysis

    A stability calculation determines whether there is a lower energy wavefunction corresponding to a different solution of the SCF equations than the wavefunction used by default. This analysis involves relaxing the constraints placed on the wavefunction by default: for example, allowing the wavefunction to become open shell or reducing the symmetry of the orbitals. Running a stability calculation can tell you if the wavefunction accurately describes the electronic structure of the molecular system you are studying and to locate a better one if it is not. This analysis is essential for many species. For example, stability analysis of both restricted and unrestricted wavefunctions of ozone will indicate the existence of an instability, and the wavefunction must be optimized before use in later modeling. This result is not surprising for a species like ozone, a singlet with an unusual electronic structure with significantly biradical character resulting from the coupling of the singly-occupied p orbitals on the terminal oxygen atoms.

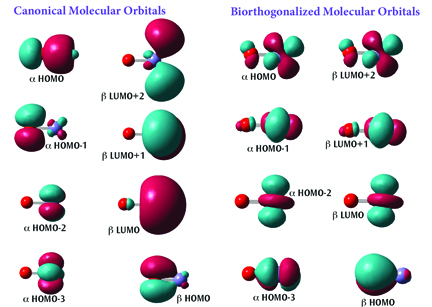
    Intuitive Molecular Orbitals

    The figure shows two sets of orbitals for FeO+(a quartet system). The default canonical orbitals (left) can be difficult to interpret for molecules like this one since they are spin polarized.

    Understanding the set of orbitals is much more straightforward. These orbitals have been biorthogonalized—transformed via an energy-invariant rotation—in order to produce the “corresponding orbitals.” With this representation, it is clear that the molecule contains five singly occupied orbitals: four α unpaired electrons localized on the iron atom, and one β unpaired electron localized on the oxygen atom.

    Gaussian 16 can also report the atomic contributions to the molecular orbitals. For example, the α HOMO in the canonical orbital set is composed of about 70% p-orbital on the oxygen and about 20% s-orbital on the iron.

    Images of canonical molecular orbitals.

    Optimization Aids and Constraints

    Gaussian 16 introduces several features which make its geometry optimization facility more powerful and flexible for the user. For example, a new option allows the force constants to be recomputed every nth step of an optimization. This will prove very useful for floppy molecules whose optimizations previously required restarts with Opt=CalcFC to complete successfully. Gaussian can also retrieve the geometry for any step of an optimization from the checkpoint file.

    Advanced Structure Constraints chart

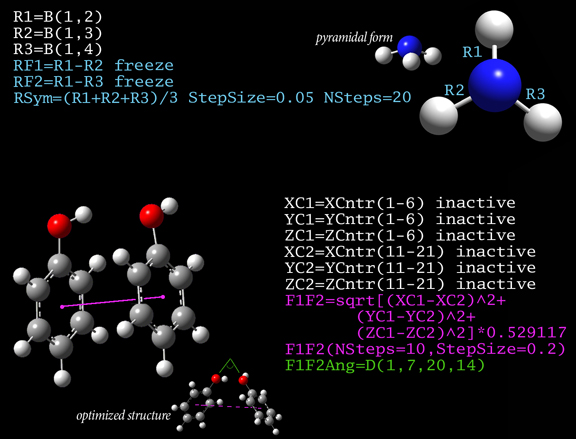
    Advanced Structure Constraints

    The figure illustrates two types of constraints that can defined using generalized internal coordinates (GICs) and then used in geometry optimizations, relaxed PES scans and other calculations. In the upper part, constraints designed to study the pyramidalization of ammonia with increasing bond length are created. First, the N-H bonds are defined as the variables R1 through R3. These bond lengths are constrained to remain the same by freezing variables defined as their differences (RF1 and RF2) at their current values (i.e., 0). Finally, a scan is set up which gradually increases the bond length in steps of 0.05 Angstroms.

    The lower part of the figure shows GICs for phenol dimer. The initial six variable definitions define X, Y and Z coordinates of the centers of the two rings (they are marked inactive since they are intermediates that should be excluded from active optimization). A relaxed PES scan is then performed with this distance as the scan variable (the factor in the expression for F1F2 is for conversion to Angstroms). During the scan, the value of the added dihedral angle coordinate F1F2Ang will be reported (C-O-O-C, where the carbon atoms are in the ring and opposite their oxygen atom); this is the angle between the two rings.

    Application Example: ROA Spectrum of Aeroplysinin-1

    Aeroplysinin-1 is a brominated compound that is of interest as an antiangiogenic drug [NietoOrtega11]. Here we will briefly discuss how Gaussian and GaussView can be used to predict its ROA spectrum in order to determine the molecule’s absolute configuration.

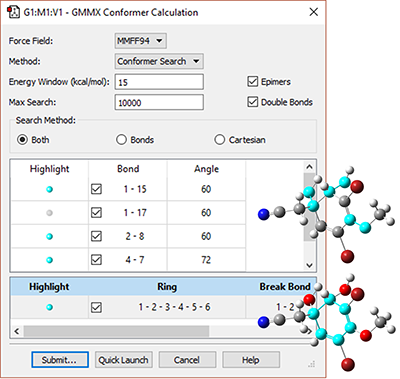
    This molecule has many possible conformations, and predicting its ROA spectrum
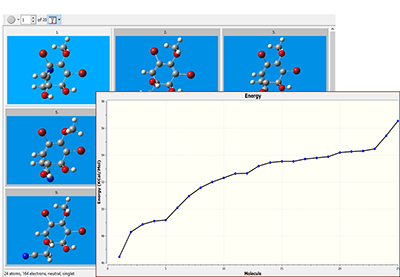
    The conformational search finds 25 unique structures within the specified energy range. The structures can be opened into a single molecule group in one step, and the Energy plot feature graphs their relative energies. After examining the structures, we run modest accuracy optimizations to determine the set of unique conformations, which we then optimize and perform a vibrational frequency analysis with a high accuracy model chemistry.
    gss-setup assign molecule group

    Once the Gaussian calculations have been set up, we can run them from within GaussView. The SC Job Manager facility provides a queueing system for the local computer, and we can save all the input files and submit them for execution as a group.

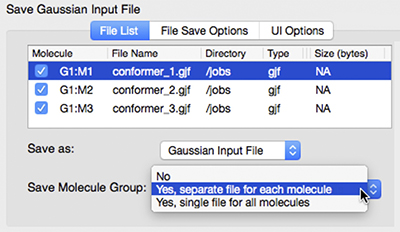
    The dialog at the left shows the multiple file save facility. We use it to assign unique file names to the input file for each structure in the molecule group, and then save all of them in a single operation.

    assign view combination screenshot
    This molecule has many possible conformations, and predicting its ROA spectrum will need to take into account all of the energetically important ones. The GMMX add-on to GaussView performs efficient and comprehensive conformational searches. We use the dialog at the left to specify the parameters of the search procedure, including the force field (here MMFF94), the types and specific bonds and rings to modify and the energy range into which potential structures must fall (<15 kcal/mol of the lowest energy structure).
    gnmx-conformers with chart
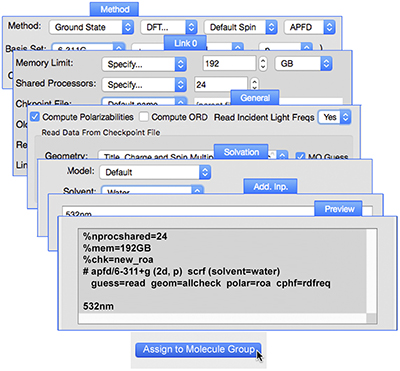
    GaussView can set up identical jobs for all of the structures within a molecule group at the same time (using the Assign to Molecule Group button). The illustration shows the various controls we used to set up the final series of jobs: ROA spectra predictions starting from the results of the high accuracy optimization plus frequency calculation for the six conformations that conribute at least 5% to the Boltzmann distribution. The new Preview panel in the Gaussian Calculation Setup dialog displays the input file generated from the dialog selections.
    multisave screenshot
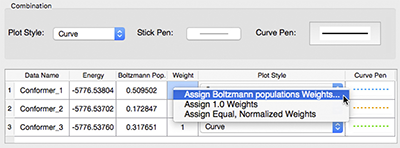
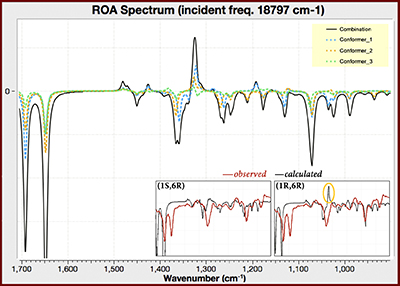
    Once the ROA calculations have completed, we can examine the predicted spectra of each conformation individually or via a multistructure spectrum plot (pictured below). The dialog shown at the right allows you to customize the plot by specifying the various line colors, types and widths. You can also scale the various curves with their Boltzmann weights as well as including the conformationally averaged combination curve.
    ROA spectrum inci frequency chart

    Predicted and Observed ROA Spectra

    This GaussView plot shows the predicted spectra for the three lowest energy conformations of (1R,6R)-Aeroplysinin-1 (the dotted lines), as well as the computationally-averaged spectrum (solid black line), over the range of 900-1700 cm-1. We have added an inset comparing the predicted and observed spectra for both diastereomers of this compound [NietoOrtega11]. The experimental spectrum corresponds to the (1S,6R) form; compare, e.g., the circled area in the predicted (1R,6R) spectrum. See [Foresman15, Exercise 7.8] for more details about this molecule.

    Ease of Use Features

    Gaussian 16

    • Opt(Recalc=n) automatically updates the force constants with accurate analytic values every nth step of a geometry optimization. It is helpful for molecular systems where large structural changes occur during the course of the optimization.
    • An expanded set of Link 0 commands: the supported set of directives provides simple, direct management of calculation resource usage. All Link 0 commands have counterparts in Default.Route file directives, so resources can be specified and managed on a system-wide basis. There are also corresponding command line options for all them so that the same features are available to scripts.
    • Tools for interfacing Gaussian with other programs, both in compiled languages such as Fortran and C and with interpreted languages such as Python and Perl. These tools are made available under a variation of the Mozilla Public License. They are designed for the following scenarios:
      • Scripts which automate running multiple related Gaussian jobs.
      • Post processing of Gaussian results.
      • Computations in other programs can use intermediate data generated by Gaussian, either by running an independent program that uses previously-calculated Gaussian results or by incorporating results from an external program into Gaussian calculations (e.g., ONIOM calculations in which the energies and forces are calculated using a method not available in Gaussian 16).
      • Rapid prototyping of new models/methods by using quantities computed by Gaussian so that only the unique aspects of the new model need to be implemented.
      • Classroom exercises employing interpreted languages such as Python or MatLab, so that they can focus on a specific issue without having to provide code for unrelated parts.
    • Generalized internal coordinates (GICs): arbitrary redundant internal coordinates can be defined. GICs can potentially be used for freezing various structural parameters during the optimization of a molecular system, specifying parameters over which to perform a scan, and defining constraints for geometry optimizations based on structural parameters or complex relationships between them.
    A GaussView brushtool.

    Many operations can be performed on all atoms in a molecule group or on a set of files in a single step. These include setting up Gaussian calculations, saving input files, submitting jobs to the SC Job Manager, and capturing molecule images as graphics files.

    The dialog at the left shows the multiple file save facility. We use it to assign unique file names to the input file for each structure in the molecule group, and then save all of them in a single operation.

    An image of a Film strip.
    The new brush selection tool allows you to quickly select a group of atoms in dense regions where the rubberband tool cannot reach and which is too large for individual clicking. You can also select atoms by bond, distance, PDB residue or defined atom group using the enhanced Atom Selection tool.
    Gaussian calculations, saving input files Image.
    The movie creating facility has been significantly enhanced. It now allows you to generate high quality MPEG4 files. You can also control the looping (direction and repetitions), the interframe delay and the frames per cycle. Defaults can be customized for all parameters for both vibrational mode animations and structure sequences.

    Fundamental Algorithms

    • Calculation of one- & two-electron integrals over any contracted gaussian functions
    • Conventional, direct, semi-direct and in-core algorithms
    • Linearized computational cost via automated fast multipole methods (FMM) and sparse matrix techniques
    • Harris initial guess
    • Initial guess generated from fragment guesses or fragment SCF solutions
    • Density fitting and Coulomb engine for pure DFT calculations, including automated generation of fitting basis sets
    • \mathcal{O}(N) exact exchange for HF and hybrid DFT
    • 1D, 2D, 3D periodic boundary conditions (PBC) energies & gradients (HF & DFT)
    • Shared-memory (SMP), cluster/network and GPU-based parallel execution

    Model Chemistries

    Molecular Mechanics

    • Amber, DREIDING and UFF energies, gradients, and frequencies
      • Custom force fields
    • Standalone MM program

    Ground State Semi-Empirical

    • CNDO/2, INDO, MINDO3 and MNDO energies and gradients
    • AM1, PM3, PM3MM, PM6 and PDDG energies, gradients and reimplemented (analytic) frequencies
    • PM7: original and modified for continuous potential energy surfaces
    • Custom semi-empirical parameters (Gaussian and MOPAC External formats)
    • DFTB and DFTBA methods

    Self Consistent Field (SCF)

    • SCF restricted and unrestricted energies, gradients and frequencies, and RO energies and gradients
    • EDIIS+CDIIS default algorithm; optional Quadratic Convergent SCF
    • SCF procedure enhancements for very large calculations
    • Complete Active Space SCF (CASSCF) energies, gradients & frequencies
      • Active spaces of up to 16 orbitals
    • Restricted Active Space SCF (RASSCF) energies and gradients
    • Generalized Valence Bond-Perfect Pairing energies and gradients
    • Wavefunction stability analysis (HF & DFT)

    Density Functional Theory

    Closed and open shell energies, gradients & frequencies, and RO energies & gradients are available for all DFT methods.

    • EXCHANGE FUNCTIONALS: Slater, Xα, Becke 88, Perdew-Wang 91, Barone-modified PW91, Gill 96, PBE, OPTX, TPSS, revised TPSS, BRx, PKZB, ωPBEh/HSE, PBEh
    • CORRELATION FUNCTIONALS: VWN, VWN5, LYP, Perdew 81, Perdew 86, Perdew-Wang 91, PBE, B95, TPSS, revised TPSS, KCIS, BRC, PKZB, VP86, V5LYP
    • OTHER PURE FUNCTIONALS: VSXC, HCTH functional family, τHCTH, B97D, M06L, SOGGA11, M11L, MN12L, N12, MN15L
    • HYBRID METHODS: B3LYP, B3P86, P3PW91, B1 and variations, B98, B97-1, B97-2, PBE1PBE, HSEh1PBE and variations, O3LYP, TPSSh, τHCTHhyb, BMK, AFD, M05, M052X, M06, M06HF, M062X, M08HX, PW6B95, PW6B95D3, M11, SOGGA11X, N12, MN12SX, N12SX, MN15, HISSbPBE, X3LYP, BHandHLYP; user-configurable hybrid methods
    • DOUBLE HYBRID: B2PLYP & mPW2PLYP and variations with dispersion, DSDPBEP86, PBE0DH, PBEQIDH (see also below in “Electron Correlation”)
    • EMPIRICAL DISPERSIONPFD, GD2, GD3, GD3BJ
    • FUNCTIONALS INCLUDING DISPERSIONAPFD, B97D3, B2PLYPD3
    • LONG RANGE-CORRECTED: LC-ωPBE, CAM-B3LYP, ωB97XD and variations, Hirao’s general LC correction
    • Larger numerical integrations grids

    Electron Correlation:

    All methods/job types are available for both closed and open shell systems and may use frozen core orbitals; restricted open shell calculations are available for MP2, MP3, MP4 and CCSD/CCSD(T) energies.

    • MP2 energies, gradients, and frequencies
    • Double hybrid DFT energies, gradients and frequencies, with optional empirical dispersion (see list in “Density Functional Theory” above)
    • CASSCF calculations with MP2 correlation for any specified set of states
    • MP3 and MP4(SDQ) energies and gradients
    • MP4(SDTQ) and MP5 energies
    • Configuration Interaction (CISD) energies & gradients
    • Quadratic CI energies & gradients; QCISD(TQ) energies
    • Coupled Cluster methods: restartable CCD, CCSD energies & gradients, CCSD(T) energies; optionally input amplitudes computed with smaller basis set
      • Optimized memory algorithm to avoid I/O during CCSD iterations
    • Brueckner Doubles (BD) energies and gradients, BD(T) energies; optionally input amplitudes & orbitals computed with a smaller basis set
    • Enhanced Outer Valence Green’s Function (OVGF) methods for ionization potentials & electron affinities
    • Complete Basis Set (CBS) MP2 Extrapolation
    • Douglas-Kroll-Hess scalar relativistic Hamiltonians

    Automated High Accuracy Energies

    • G1, G2, G3, G4 and variations
    • CBS-4, CBS-q, CBS-QB3, ROCBS-QB3, CBS-Q, CBS-APNO
    • W1U, W1BD, W1RO (enhanced core correlation energy calculation)

    Basis Sets and DFT Fitting Sets

    • STO-3G, 3-21G, 6-21G, 4-31G, 6-31G, 6-31G†, 6-311G, D95, D95V, SHC, CEP-nG, LanL2DZ, cc-pV{D,T,Q,5,6}Z, Dcc-p{D,T}Z, SV, SVP, TZV, QZVP, EPR-II, EPR-III, Midi!, UGBS*, MTSmall, DG{D, T}ZVP, CBSB7
      • Augmented cc-pV*Z schemes: Aug- prefix, spAug-, dAug-, Truhlar calendar basis sets (original and regularized)
    • Effective Core Potentials (through second derivatives): LanL2DZ, CEP through Rn, Stuttgart/Dresden
    • Support for basis functions and ECPs of arbitrary angular momentum
    • DFT FITTING SETS: DGA1, DGA1, W06, older sets designed for SVP and TZVP basis sets; auto-generated fitting sets; optional default enabling of density fitting

    Geometry Optimizations and Reaction Modeling

    • Geometry optimizations for equilibrium structures, transition structures, and higher saddle points, in redundant internal, internal (Z-matrix), Cartesian, or mixed internal and Cartesian coordinates
    • GEDIIS optimization algorithm
    • Redundant internal coordinate algorithm designed for large system, semi-empirical optimizations
    • Newton-Raphson and Synchronous Transit-Guided Quasi-Newton (QST2/3) methods for locating transition structures
    • IRCMax transition structure searches
    • Relaxed and unrelaxed potential energy surface scans
    • Implementation of intrinsic reaction path following (IRC), applicable to ONIOM QM:MM with thousands of atoms
    • Reaction path optimization
    • BOMD molecular dynamics (all analytic gradient methods); ADMP molecular dynamics: HF, DFT, ONIOM(MO:MM)
    • Optimization of conical intersections via state-averaged CASSCF
    • Generalized internal coordinates for complex optimization constraints

    Vibrational Frequency Analysis

    • Vibrational frequencies and normal modes (harmonic and anharmonic), including display/output limiting to specified atoms/residues/modes (optional mode sorting)
    • Restartable analytic HF and DFT frequencies
    • MO:MM ONIOM frequencies including electronic embedding
    • Analytic Infrared and static and dynamic Raman intensities (HF & DFT; MP2 for IR)
    • Pre-resonance Raman spectra (HF and DFT)
    • Projected frequencies perpendicular to a reaction path
    • NMR shielding tensors & GIAO magnetic susceptibilities (HF, DFT, MP2) and enhanced spin-spin coupling (HF, DFT)
    • Vibrational circular dichroism (VCD) rotational strengths (HF and DFT; harmonic and anharmonic)
    • Dynamic Raman Optical Activity (ROA) intensities (harmonic and anharmonic)
    • Raman and ROA intensities calculated separately from force constants in order to use a larger basis set
    • Harmonic vibration-rotation coupling
    • Enhanced anharmonic vibrational analysis, including IR intensities, DCPT2 & HDCPT2 method for resonance-free computations of anharmonic frequencies
    • Anharmonic vibration-rotation coupling via perturbation theory
    • Hindered rotor analysis

    Molecular Properties

    • Population analysis, including per-orbital analysis for specifed orbitals: Mulliken, Hirshfeld, CM5
    • Computed atomic charges can be saved for use in a later MM calculation
    • Electrostatic potential, electron density, density gradient, Laplacian, and magnetic shielding & induced current densities over an automatically generated grid
    • Multipole moments through hexadecapole
    • Biorthogonalization of MOs (producing corresponding orbitals)
    • Electrostatic potential-derived charges (Merz-Singh-Kollman, CHelp, CHelpG, Hu-Lu-Yang)
    • Natural orbital analysis and natural transition orbitals
    • Natural Bond Orbital (NBO) analysis, including orbitals for CAS jobs. Integrated support for NBO3; external interface to NBO6
    • Static and frequency-dependent analytic polarizabilities and hyperpolarizabilities (HF and DFT); numeric 2nd hyperpolarizabilities (HF; DFT w/ analytic 3rd derivs.)
    • Approx. CAS spin orbit coupling between states
    • Enhanced optical rotations and optical rotary dispersion (ORD)
    • Hyperfine spectra components: electronic g tensors, Fermi contact terms, anisotropic Fermi contact terms, rotational constants, dipole hyperfine terms, quartic centrifugal distortion, electronic spin rotation tensors, nuclear electric quadrupole constants, nuclear spin rotation tensors
    • ONIOM integration of electric and magnetic properties

    ONIOM Calculations

    • Enhanced 2 and 3 layer ONIOM energies, gradients and frequencies using any available method for any layer
    • Optional electronic embedding for MO:MM energies, gradients and frequencies implemented so as to include all effects of the MM environment without neglecting terms in its coupling with the QM region
    • Enhanced MO:MM ONIOM optimizations to minima and transition structures via microiterations including electronic embedding
    • Support for IRC calculations
    • ONIOM integration of electric and magnetic properties

    Excited States

    • ZINDO energies
    • CI-Singles energies, gradients, & freqs.
    • Restartable time-dependent (TD) HF & DFT energies, gradients and frequenciesTD-DFT can use the Tamm-Dancoff approximation.
    • SAC-CI energies and gradients
    • EOM-CCSD energies and gradients (restartable); optionally input amplitudes computed with a smaller basis set
    • Franck-Condon, Herzberg-Teller and FCHT analyses
    • Vibronic spectra including electronic circular dichroism (ECD) rotational strengths (HF and DFT)
    • Resonance Raman spectra
    • Ciofini’s excited state charge transfer diagnostic (Dct)
    • Caricato’s EOMCC solvation interaction models
    • CI-Singles and TD-DFT in solution
    • State-specific excitations and de-excitations in solution
    • An energy range for excitations can be specified for CIS and TD excitation energies

    Self-Consistent Reaction Field Solvation Models

    • New implementation of the Polarized Continuum Model (PCM) facility for energies, gradients and frequencies
    • Solvent effects on vibrational spectra, NMR, and other properties
    • Solvent effects for ADMP trajectory calcs.
    • Solvent effects for ONIOM calculations
    • Enhanced solvent effects for excited states
    • SMD model for ΔG of solvation
    • Other SCRF solvent models (HF & DFT): Onsager energies, gradients and freqs., Isodensity Surface PCM (I-PCM) energies and Self-Consistent Isodensity Surface PCM (SCI-PCM) energies and gradients

    Ease-of-Use Features

      • Automated counterpoise calculations
      • Automated optimization followed by frequency or single point energy
      • Ability to easily add, remove, freeze, differentiate redundant internal coords.
      • Simplified isotope substitution and temperature/pressure specification in the route section
      • Optimizations
        • Retrieve the nth geometry from a checkpoint file
        • Recompute the force constants every nth step of a geometry optimization
        • Reduce the maximum number of allowed steps, including across restarts
        • 180° flips detected and suppressed for better visualization
      • Freezing by fragment for ONIOM optimizations
      • Simplified fragment definitions on molecule specifications
      • Many more restartable job types
      • Atom freezing in optimizations by type, fragment, ONIOM layer and/or residue


    • QST2/QST3 automated transition structure optimizations
    • Saving and reading normal modes
    • %OldChk Link 0 command specifies read-only checkpoint file for data retrieval
    • Default.Route file for setting calculation defaults
    • Enhanced set of equivalent Default.Route directives, Link 0 commands, command line options and environment variables

    Integration with External Programs

    • NBO 6
    • COSMO/RS
    • AIMPAC WfnX files
    • Antechamber
    • ACID
    • Pickett’s program
    • DFTB input file
    • General external interface script-based automation, results post-processing, interchanging data/calculation results with other programs, and so on:
      • Interface routines in Fortran, Python and Perl (open source)
      • Keyword and Link 0 command support
    An Image of a molecule vector breakthrough.
    lightbeam-computational-chemistry

    Why Gaussian?

    Here are six compelling reasons to choose our Gaussian Platform for your computational chemistry and drug development needs:

    N

    Cost Efficiency

    Computational chemistry and in silico labs significantly reduce the costs associated with reagents, materials, and physical lab space required for wet labs.

    N

    Speed

    Simulations and computational models can rapidly screen and optimize drug candidates, accelerating the initial phases of drug development compared to the slower pace of wet lab experiments.

    N

    Safety

    In silico methods eliminate the risks associated with handling hazardous chemicals and conducting potentially dangerous experiments, ensuring a safer research environment.

    N

    Scalability

    Computational models can easily be scaled to study larger and more complex molecular systems, which may be challenging or impractical in wet labs.

    N

    Predictive Power

    Advanced algorithms and simulations provide detailed insights into molecular interactions and predict properties and behaviors that may not be easily observable in wet lab experiments.

    N

    Resource Conservation

    In silico labs conserve valuable resources, including rare or expensive materials, by allowing extensive testing and optimization in a virtual environment before any physical trials.

    If you're interested in setting up your own Computational Chemistry Lab, or simply learning more about a personal lab, please fill out the form below. We look forward to speaking with you.

    3 + 9 =